
The United States is on course for its biggest-ever year of power capacity additions. According to the April 2026 Electric Power Monthly report from the U.S. Energy Information Administration (EIA), developers plan to bring 86 GW of new utility-scale capacity online in 2026. Clean technologies dominate the pipeline: solar panels and battery storage together represent nearly 80% of all planned additions. Meanwhile, renewable generation grew 10.8% in the first two months of the year, reaching a 26% share of total U.S. electricity output.
Utility-scale solar leads the charge with 43.4 GW planned for 2026—a 60% jump compared to 2025 installations. Texas remains the undisputed solar hub, accounting for 40% of all new large-scale projects nationwide. The headline addition is the 837 MW Tehuacana Creek 1 facility in Texas, set to be the largest solar PV plant to come online this year. Small-scale solar is also thriving: the U.S. surpassed 60 GW of total distributed solar capacity as of February 2026, having added over 6 GW in the preceding 12 months.
Battery energy storage is scaling at a record pace alongside solar. Developers plan to add 24 GW of utility-scale storage in 2026, up sharply from 15 GW installed in 2025. The EIA forecasts total U.S. battery storage capacity will climb from 44.6 GW to over 67 GW by the end of Q1 2027. Growth is concentrated in three states: Texas leads with 12.9 GW (53% of new capacity), followed by California at 3.4 GW and Arizona at 3.2 GW. Flagship projects include the 621 MW Lunis Creek BESS in Jackson, Texas, and the 500 MW Bellefield 2 Solar & Energy Storage Farm in Kern County, California.
Wind power is also accelerating after years of slower growth, with 11.8 GW of new capacity expected in 2026—more than double the previous year's additions. Two major offshore wind projects are part of the lineup: the 800 MW Vineyard Wind 1 and the 715 MW Revolution Wind. Hydropower output in the West is projected to increase by 6%, buoyed by strong reservoir levels after a wet winter. The EIA expects the combined solar and wind share to exceed 20% of U.S. electricity generation by early 2027, while natural gas capacity share is set to fall below 39%—a landmark moment in the American energy transition.
Source: Solar and storage expected to drive 86 GW capacity surge in the U.S. this year - PV Magazine International· Based on source, with AI-assisted rewriting.
Related articles

How Much Do Solar Panels Produce in Winter? Realistic Numbers
Winter output from a rooftop solar system is a fraction of the summer peak: shorter days, a low sun, cloud and snow mean that the four darkest months together typically deliver only around a tenth to a fifth of the annual yield, depending on latitude. This guide sets realistic month-by-month expectations, explains what winter means for self-consumption and your bill, shows how a battery and smart scheduling help, and why you should never size a system for December.

Pre-Season Heat Pump Checklist: What to Check in September
A heat pump does most of its work in the coldest months, but how much electricity it burns doing so is largely decided in September. Here is what homeowners can check themselves, from the outdoor unit to the heating curve, what to leave to a qualified engineer, and how to get the most out of rooftop solar in the autumn months.

Air conditioning on solar power: what summer cooling really costs in 2026
In a heatwave, air conditioning becomes one of the biggest loads in a household — exactly when solar panels produce the most. We look at what cooling costs with and without solar, how much extra capacity you need, and what to watch for when sizing a system.
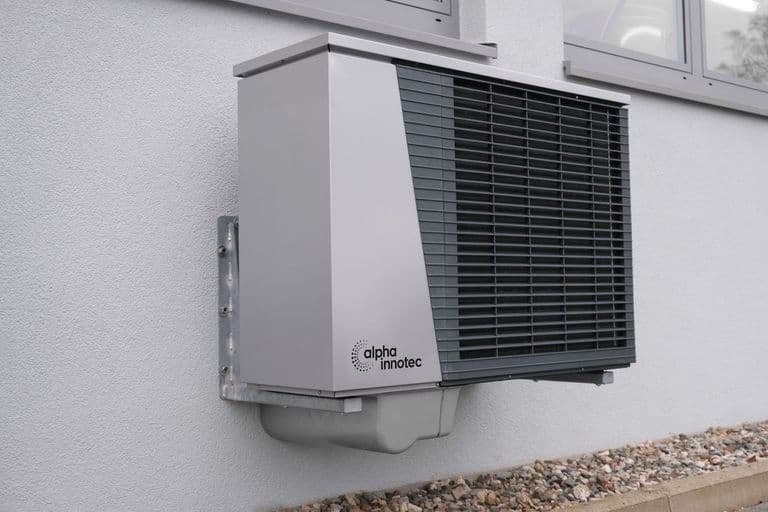
Heat Pump, Solar & H Tariff: How to Plan Together
Combining a heat pump, rooftop solar panels and a preferential electricity tariff can significantly cut household energy bills — but only if you plan all three as one integrated system. This guide walks through the decision logic, common mistakes and key considerations for homeowners.
Comments
0 commentsBe the first to comment.